Wazuh + SOAR Implementation
My very first project! Creating a makeshift SOC featuring SIEM, SOAR and case management.

Project objective
- Spin up WAZUH and have at least one agent checking in
- Integrate SOAR for basic automation
Introduction
The aim of this project is to develop from scratch a fully integrated SOAR (Security Orchestration, Automation, and Response) solution incorporating Wazuh for intrusion detection & incident response coupled with TheHive for case management. Additionally, the goal is to create incident response efficiency through effective automated responses with robust logging. Inspiration for this project comes from my curiosity to learn about security operations and wanting to develop my skills in developing and integrating different security tools.
Main software to be used
- Wazuh
- Wazuh is an open-source SIEM (Security Information Event Management) system that collects, analyses, aggregates, indexes, and analyses security-related data which is used to detect intrusions, attacks, vulnerabilities, and malicious activity. It will be the core intrusion detection system in this project as we monitor security events.
- TheHive
- Another open-source platform, it’s a 4-in-1 security incident response platform featuring case management, automation, and collaboration tools in addition to threat intelligence support. We’ll be using this for our case management system.
- Shuffle
- This will be our SOAR platform to build security workflows and receive alerts, check malware reputation score with VirusTotal and send alert emails.
Mapping out our lab logically
Visual diagram for the logical implementation of this lab. This will be our visual guide for setting up and configuring the lab, and how data might flow through each component so we can achieve efficient and automated incident response for this project. 
Getting started
Creating a Windows virtual machine
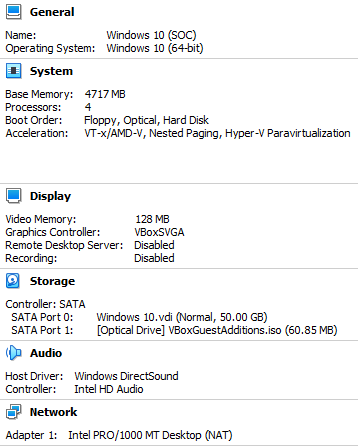
We will need a Windows 10/11 VM to simulate the client environment. Personally, I used Oracle VM VirtualBox for my virtualisation software. There are many online tutorials that show how to setup and create one such as this article for Windows 10 and this YouTube video for Windows 11:
The specifications of the VM I’ve made are shown down below, I’ll be using this VM for the duration of the project.
Installing sysmon with sysmonconfig
Sysmon is a Windows system service and device driver that provides detailed information about process creations, network connections, file changes, registry modifications, and more. Sysmon logs will be ingested into the SIEM system so malicious activity can be identified. We’ll be using sysmon-modular, a sysmon configuration that extends its functionality to monitor and log more comprehensively.
Once sysmon is extracted, and our sysmonconfig.xml is saved into the same directory as sysmon. We can open up a Powershell terminal inside the directory and install our config using:
1
.\Sysmon64.exe -i .\sysmonconfig.xml
To verify that we now have Sysmon installed on our client PC, open Event Viewer and go to Applications and Services Log > Microsoft > Windows, and look for the Sysmon folder.
Creating Wazuh and TheHive servers
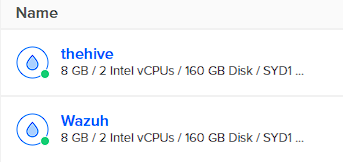
I’ll be using DigitalOcean as my cloud provider, but any other cloud provider will be optimal too. DigitalOcean calls its cloud servers “droplets” and we will need to create 2 droplets, one for Wazuh and one for TheHive. Both droplets will have these specifications:
- 8 GB Memory
- 2 Intel vCPUs
- 160 GB Disk
- Region: Where you currently reside (In my case, Australia/Sydney)
- Operating System: Ubuntu 22.04 (LTS) x64
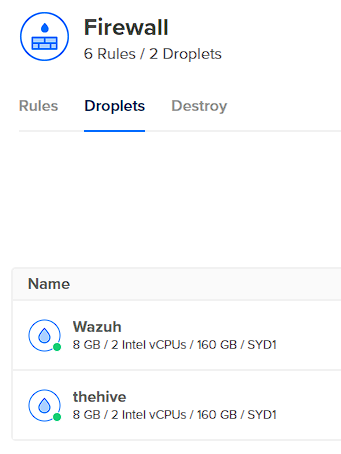
In addition, I will be creating a firewall to be used for both servers to restrict all incoming traffic on TCP and UDP, and only allow requests from my IP address. Outbound rules will be left on default. This measure is to safeguard our servers from unauthorised access attempts by intruders or any automated bots or scanners traversing the Internet hitting our servers and trying to break in. 
Our droplets then need to be added to our firewall.
Installing Wazuh and TheHive
This step consists primarily of using bash commands to manage the installation of both Wazuh and TheHive. The first step is to connect to our Wazuh server through SSH, I’ll be using PuTTY to connect to the server from my host machine.
You won’t be able to launch the Droplet console (found in the access tab) to achieve the same task as we configured our droplets to only accept connections from our IP address. Instead, install a ssh client on your host machine (such as PuTTY) and connect from there.
Once we’re connected to our wazuh server, we can begin to update the Ubuntu system using:
1
apt-get update && apt-get upgrade -y
Then installing Wazuh:
1
curl -sO https://packages.wazuh.com/4.7/wazuh-install.sh && sudo bash ./wazuh-install.sh -a
Once the installation has finished, Wazuh will give you a default username and automatically generate a strong password so you can login into the web interface. Take note of these credentials, then copy and paste the public IPv4 address of the Wazuh droplet into the web browser of your choice. The Wazuh dashboard will greet you with the login screen and you’ll be able to access all its features from there.
1
2
- To access Wazuh:
https://ipaddress
Now that Wazuh is installed onto the Wazuh server, it’s time to install TheHive on our TheHive server. After we’ve connected to the TheHive server through SSH, we must install a few dependencies.
1
apt install wget gnupg apt-transport-https git ca-certificates ca-certificates-java curl  software-properties-common python3-pip lsb-release
Then install java:
1
2
3
4
5
6
wget -qO- https://apt.corretto.aws/corretto.key | sudo gpg --dearmor  -o /usr/share/keyrings/corretto.gpg
echo "deb [signed-by=/usr/share/keyrings/corretto.gpg] https://apt.corretto.aws stable main" |  sudo tee -a /etc/apt/sources.list.d/corretto.sources.list
sudo apt update
sudo apt install java-common java-11-amazon-corretto-jdk
echo JAVA_HOME="/usr/lib/jvm/java-11-amazon-corretto" | sudo tee -a /etc/environment
export JAVA_HOME="/usr/lib/jvm/java-11-amazon-corretto"
Then Cassandra:
1
2
3
4
wget -qO -  https://downloads.apache.org/cassandra/KEYS | sudo gpg --dearmor  -o /usr/share/keyrings/cassandra-archive.gpg
echo "deb [signed-by=/usr/share/keyrings/cassandra-archive.gpg] https://debian.cassandra.apache.org 40x main" |  sudo tee -a /etc/apt/sources.list.d/cassandra.sources.list
sudo apt update
sudo apt install cassandra
Then ElasticSearch:
1
2
3
4
5
wget -qO - https://artifacts.elastic.co/GPG-KEY-elasticsearch |  sudo gpg --dearmor -o /usr/share/keyrings/elasticsearch-keyring.gpg
sudo apt-get install apt-transport-https
echo "deb [signed-by=/usr/share/keyrings/elasticsearch-keyring.gpg] https://artifacts.elastic.co/packages/7.x/apt stable main" |  sudo tee /etc/apt/sources.list.d/elastic-7.x.list
sudo apt update
sudo apt install elasticsearch
Then finally, TheHive:
1
2
3
4
wget -O- https://archives.strangebee.com/keys/strangebee.gpg | sudo gpg --dearmor -o /usr/share/keyrings/strangebee-archive-keyring.gpg
echo 'deb [signed-by=/usr/share/keyrings/strangebee-archive-keyring.gpg] https://deb.strangebee.com thehive-5.2 main' | sudo tee -a /etc/apt/sources.list.d/strangebee.list
sudo apt-get update
sudo apt-get install -y thehive
To access TheHive, copy and paste the IPv4 address of TheHive droplet into the web browser of your choice, on port 9000.
1
2
- To access TheHive:
http://ipaddress:9000
You will be greeted with a login screen, and the default credentials to login are:
- Username: admin@thehive.local
- Password: secret
It’s a good idea to change the default password once you login, more information on how to can be found here.
Configuring TheHive for use
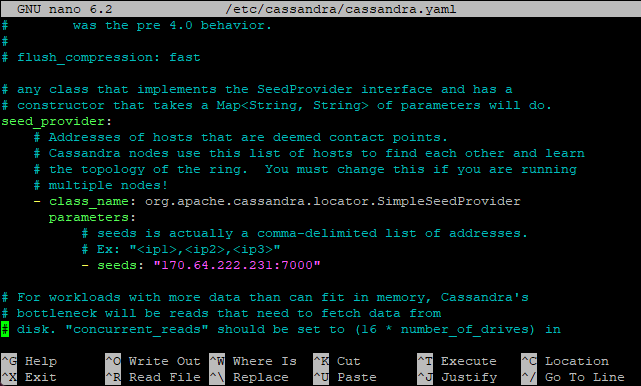
The first step is to connect to TheHive server and configure Cassandra (used for TheHive’s database) to work with TheHive, this includes changing its listening, RPC, and seed address to TheHive server IP address, as well as the cluster name (optional but recommended).
1
nano /etc/cassandra/cassandra.yaml # Command to edit cassandra config file
Then remove old files from the default installation that Cassandra left, start the service, and check if it’s running:
1
2
3
rm -rf /var/lib/cassandra/*
systemctl start cassandra.service
systemctl status cassandra.service
Next up is to configure Elasticsearch, changing the cluster name, node name, and network host to TheHive IP address, as well as removing the default 2nd node in the cluster.initial_master_nodes field.
1
nano /etc/elasticsearch/elasticsearch.yml
Then we need to give TheHive ownership to the attachment storage configuration we gave it (Cassandra) so it can write into that directory.
1
chown -R thehive:thehive /opt/thp
And lastly, modify TheHive’s configuration. This includes changing the hostname IP address for both storage and index.search fields, the cluster name to the one we used for Cassandra and application.baseUrl to the public IP of TheHive.
1
nano /etc/thehive/application.conf
Finally, we can start up TheHive and check if it’s running
1
2
3
systemctl start thehive
systemctl enable thehive
systemctl status thehive
Configuring Wazuh for use
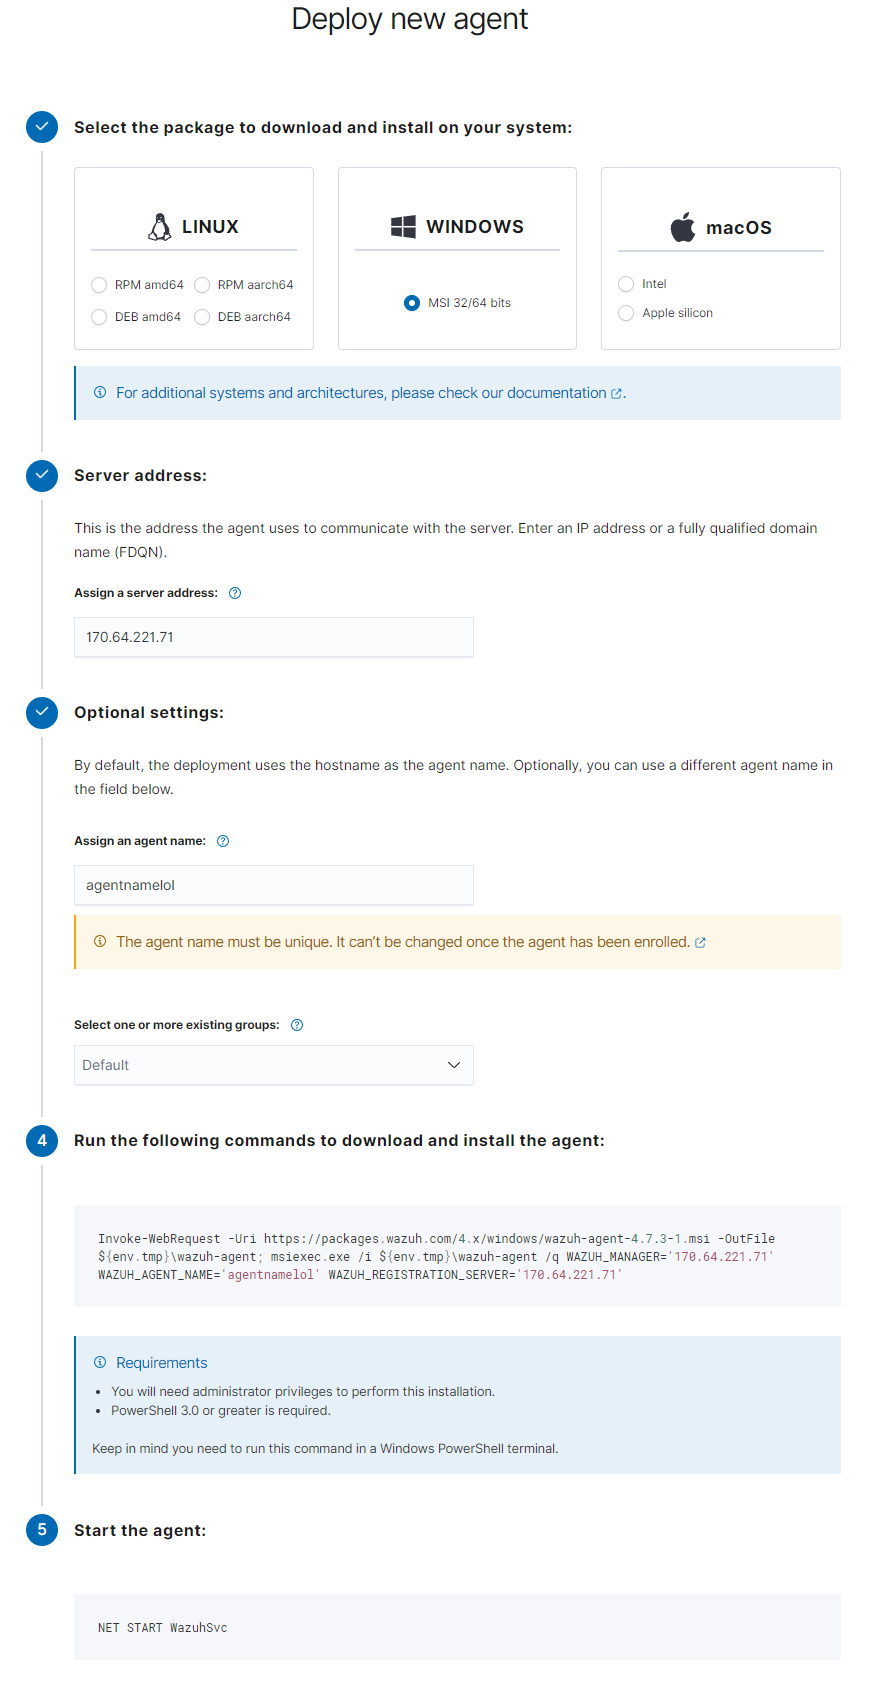
We will begin by heading to our Wazuh dashboard and deploying our first agent (which will be our client PC). We will first select Windows for the package we want to install, then the public IP of Wazuh will be the server address, and lastly, naming our agent. Wazuh will then generate a command for you in step 4, run this command inside PowerShell (with administrative privileges) on the client PC, then, start the agent using the command Wazuh gives you in step 5.
After a few seconds, Wazuh dashboard will show you that you have one active agent. Upon clicking on active agents and then the agent itself, you will be greeted with another dashboard that displays almost everything you would need to know! A few examples include:
- Security events
- Integrity monitoring
- Vulnerabilities
- Regulatory compliance
- Security policy monitoring

With the configuration of Wazuh and TheHive now completed, we can start putting them to use. Our next step is to create custom alerts based on the telemetry we are to create using grey-hat tools.
Generating telemetry
Setting up
Telemetry is the process of collecting, recording, and analysing data from computer systems or networks to understand how they are operating. This data can be system performance metrics, network traffic details, application behaviour, security event information and/or user activities. Our next step is to tell Wazuh to ingest the logs sysmon generates.
On our client PC, We’ll first need to take note of sysmon’s full name. This is found inside the log properties for sysmon using event viewer.

Now we need to add a new local log file source for Wazuh to ingest, which will be sysmon. The ossec.conf file is the main configuration file for Wazuh and is found at C:\Program Files (x86)\ossec-agent\ossec.conf. There will already be existing log sources under <!-- Log analysis -->, but we will be adding sysmon as a new log source under the existing ones, shown below is how this addition would look like:
1
2
3
4
<localfile>
    <location>Microsoft-Windows-Sysmon/Operational</location>
    <log_format>eventchannel</log_format>
</localfile>
Once that’s done, we can save the file and restart the Wazuh service.
Restarting the Wazuh service can be accomplished through the Windows Services interface. Search for “Services” in Windows, locate the Wazuh service, right-click on it and select “Restart”.
Using Mimikatz
Our next step is to test Wazuh’s ability to detect and report anomalies/incidents within the sysmon logs that are generated on our client PC. We can do this by installing straight-up malware, or just using grey-hat tools. For this project, I’ll be using a tool called mimikatz, a popular tool by red-teamers that is designed to extract credentials such as passwords, hashes, PIN codes, Kerberos tickets and other sensitive information from Windows-based systems.
Heading back onto our client VM, mimikatz can be installed here (File name is mimikatz_trunk.zip).
You will need to exclude the downloads folder from Microsoft Defender and disable any browser protection that may be on. Otherwise, mimikatz will get blocked.
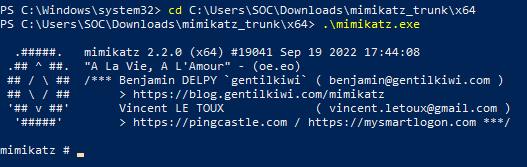
Then we can proceed to extract mimikatz and run it inside PowerShell.
Now let’s head back to our Wazuh dashboard and see how it responded to the execution of mimikatz on our client VM.
We can see that it has indeed responded pretty heavily.

Many of the alerts consisted of tactics such as privilege escalation and command & control. Each alert on a basic level contains a timestamp, technique(s), tactic(s), description, level (severity rating), and a Rule ID. However, each alert can be investigated individually to reveal even more fields related to the alert.

What I found particularly interesting, is when clicking upon the technique hyperlink (T1105). It directs you to MITRE ATT&CK tab, and explains the details of what the technique is, what it does, and how it works.
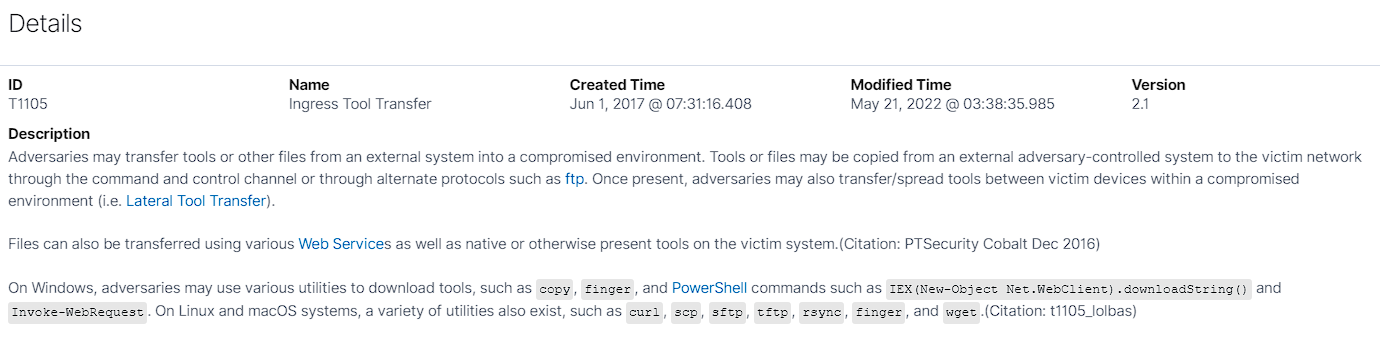
The MITRE ATT&CK framework is a globally accessible and comprehensive collection of tactics, techniques and procedures (TTPs) that attackers use in the real world. Looking up the Mitre ID (T1105) on MITRE ATT&CK shows a more comprehensive description and examples of real-world usage using the technique.
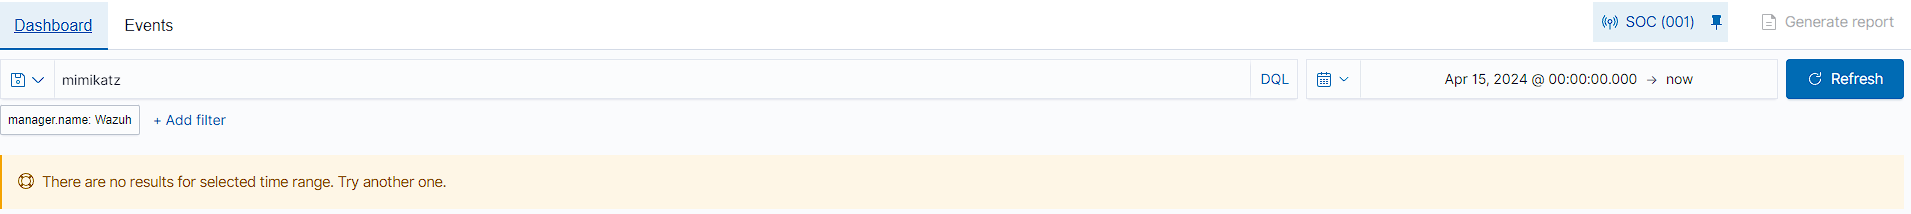
However, when we try search for mimikatz in the search bar to detect if it was executed. No results show at all. Thats because Wazuh by default only logs when a rule or alert is triggered.
It is possible to get Wazuh to log everything, this can be done by configuring the
ossec.conffile to<logall>yes</logall>and<logall_json>yes</logall_json>, the rest of the instructions can be found here.
Creating a custom rule
Let’s go ahead and create a custom rule to detect mimikatz! We can do this in Management > Administration > Rules then clicking on “Manage rules files”. Searching for sysmon, we are particularly interested in 0800-sysmon_id_1.xml because it contains all Event ID 1 rules (which encompass process creation).
Inside 0800-sysmon_id_1.xml, I’ll be copying out one of the built-in sysmon rules to build out the custom rule for mimikatz.
1
2
3
4
5
6
7
8
9
10
11
12
<!--
  One of the default sysmon Event ID 1 rules
-->
<rule id="92000" level="4">
    <if_group>sysmon_event1</if_group>
    <field name="win.eventdata.parentImage" type="pcre2">(?i)\\(c|w)script\.exe</field>
    <options>no_full_log</options>
    <description>Scripting interpreter spawned a new process</description>
    <mitre>
      <id>T1059.005</id>
    </mitre>
</rule>
Now we can head to the custom rules file (local_rules.xml) by pressing on the custom rules button.
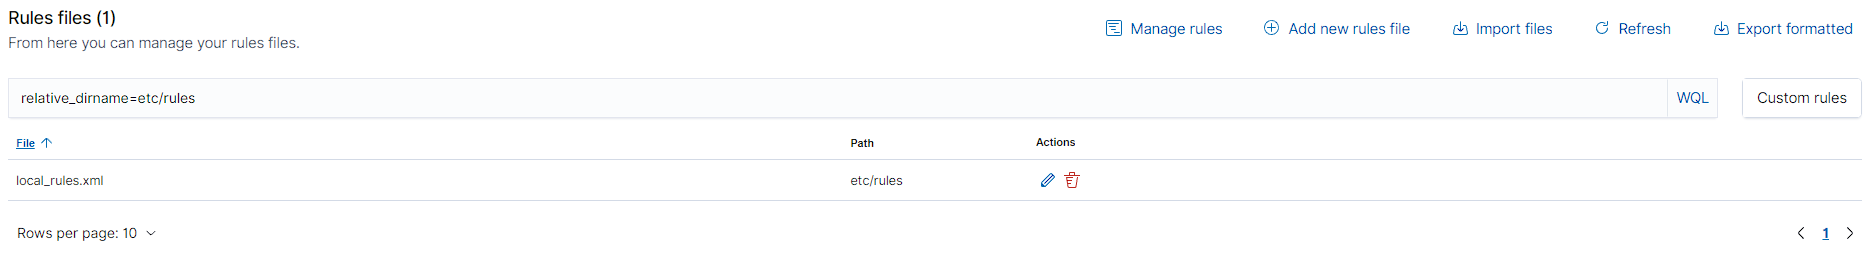
Inside, we will paste the default sysmon rule we just copied below the rule that’s inside the file already.
1
2
3
4
5
6
7
8
9
10
11
12
13
14
15
16
17
18
19
20
21
22
23
24
25
26
27
28
29
<!-- Local rules -->

<!-- Modify it at your will. -->
<!-- Copyright (C) 2015, Wazuh Inc. -->

<!-- Example -->
<group name="local,syslog,sshd,">

<!--
Dec 10 01:02:02 host sshd[1234]: Failed none for root from 1.1.1.1 port 1066 ssh2
-->
<rule id="100001" level="5">
    <if_sid>5716</if_sid>
    <srcip>1.1.1.1</srcip>
    <description>sshd: authentication failed from IP 1.1.1.1.</description>
    <group>authentication_failed,pci_dss_10.2.4,pci_dss_10.2.5,</group>
</rule>

<rule id="92000" level="4">
    <if_group>sysmon_event1</if_group>
    <field name="win.eventdata.parentImage" type="pcre2">(?i)\\(c|w)script\.exe</field>
    <options>no_full_log</options>
    <description>Scripting interpreter spawned a new process</description>
    <mitre>
    <id>T1059.005</id>
    </mitre>
</rule>

</group>
Primarily, we will focus on changing these fields for our custom rule:
- ID: Custom rules start from 100,000. As we can see, the previous rule has an ID of 100,001 so we will change our custom rule to 100,002.
- Level: This is the severity rating we want our alert to have, 15 being the highest possible level. For now, we’ll just make it 12.
- Field name: Currently it’s
win.eventdata.parentImage, which is a good field as it tracks the chain of events in process creation. but I will change it towin.eventdata.originalFileName. I made this choice because if I were to use something likewin.eventdata.image, a simple file rename would render the whole rule useless. - Type: This field is written in regex, we will change it to
type="pcre2">(?i)mimikatz\.exe</field>so it searches specifically for mimikatz in the original file name. - Options: We will remove this field because we want all logs.
- Description: This can be anything, I will just use “Mimikatz Detected” for the description.
- Mitre: We’ll change this to T1003, the MITRE ID for OS Credential Dumping as mimikatz is a credential dumper.
Now, our custom rule should look like this:
1
2
3
4
5
6
7
8
<rule id="100002" level="12">
    <if_group>sysmon_event1</if_group>
    <field name="win.eventdata.originalFileName" type="pcre2">(?i)mimikatz\.exe</field>
    <description>Mimikatz Detected</description>
    <mitre>
        <id>T1003</id>
    </mitre>
</rule>
Once that’s done, we can save the file. Wazuh will tell us to restart the manager so we will do that too.
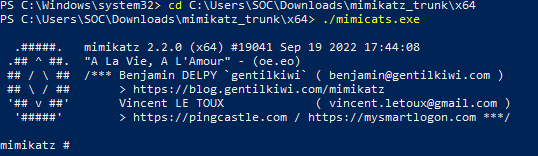
Before we put this rule to the test, I will rename the mimikatz file to something different, maybe like “mimicats” to see if our custom rule works with the win.eventdata.originalFileName field.
Back on our client PC, I’ll now run mimicats.exe and see what happens on Wazuh.
And hooray! A new alert popped up on our security events dashboard and it’s the custom rule we made to detect mimikatz usage.

As we can see, the alert does show the win.eventdata.image field to be mimicats.exe. But, the win.eventdata.originalFileName field shows mimikatz.exe. Ultimately, it was a good decision to use the win.eventdata.originalFileName field as the rule still triggered even with file rename, which would not have happened if we were to just track the win.eventdata.image field.
Integrating Shuffle (SOAR)
Creating the workflow
Now we will use Shuffle to start creating the SOAR aspect of our project.
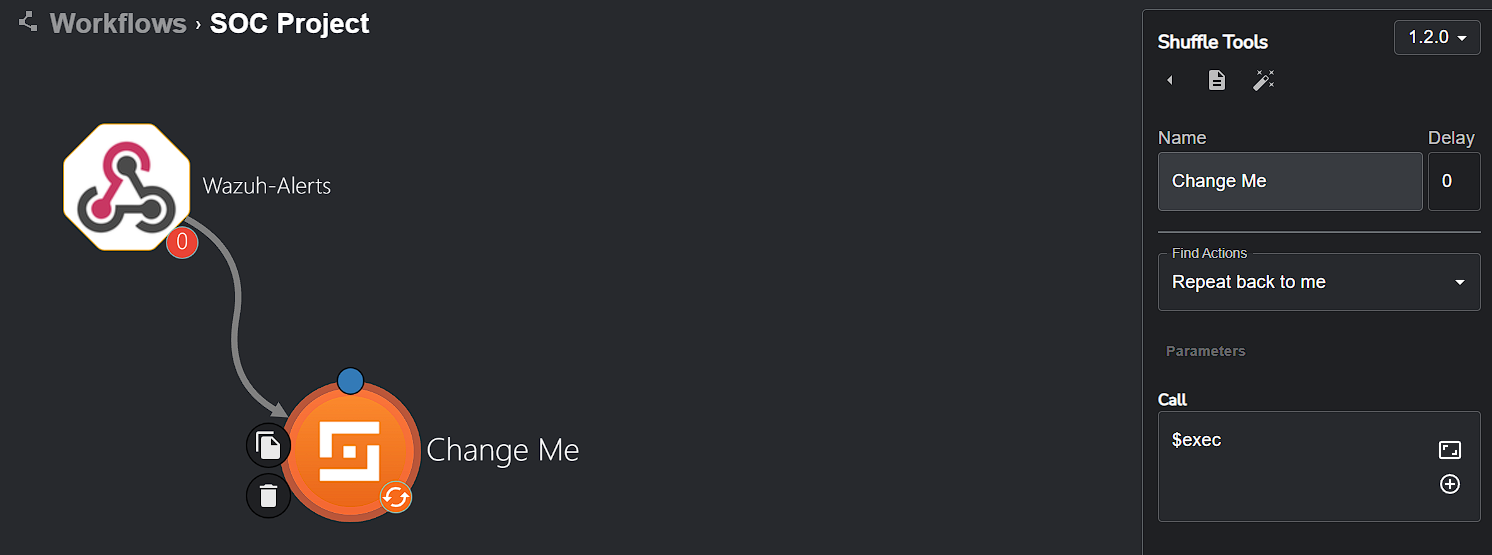
Upon creating a new workflow, we’re greeted with this default screen:

Essentially, workflows in Shuffle connect different apps, triggers and variables to achieve automation for any task you may have in mind. Starting off, we will add a trigger to our workflow (a trigger is how our workflow gets accessed/run) which will be a webhook. The webhook will allow custom, real-time HTTP input (which will be Wazuh alerts) into our workflow.

Next, we will edit the Call section of the Shuffle tools app to hold $exec. It will be much clearer why we did this in just a moment.
To get Wazuh connected with Shuffle, we need to copy the Webhook URI and make a new integration tag inside ossec.conf of our Wazuh manager. So, moving forward, we will SSH into our Wazuh droplet and add the integration tag inside ossec.conf for Shuffle.
The
ossec.conffile for the Wazuh manager is located at/var/ossec/etc/ossec.confand we can edit the file using nanonano /var/ossec/etc/ossec.confinside a CLI. More integration tag examples for different external APIs can be found here.
1
2
3
4
5
6
7
8
<!-- Integration with Shuffle -->
<integration>
  <name>shuffle</name>
  <hook_url>http://IP:3001/api/v1/hooks/HOOK_ID</hook_url> <!-- Replace with your Shuffle hook URL -->
  <level>3</level>
  <alert_format>json</alert_format>
  <options>{"data": {"title": "Custom title"}}</options> <!-- Replace with your custom JSON object -->
</integration>
The only thing we will be changing is <hook_url> to the Webhook URI we copied earlier and replacing <level> to <rule_id>. As currently, <level>3</level> means to send all level 3 alerts to shuffle, but we only want to send over alerts for mimikatz so we can remove this tag and add <rule_id></rule_id> with our rule ID for mimikatz (which was 100002). Lastly, we will also remove the <options> tag as we don’t want to overwrite any fields that’s provided in the JSON object.
1
2
3
4
5
6
<integration>
  <name>shuffle</name>
  <hook_url>https://shuffler.io/api/v1/hooks/webhook_8c7acdd4-f687-426e-bbb0-fd8e4d10b0bd </hook_url>
  <rule_id>100002</rule_id>
  <alert_format>json</alert_format>
</integration>
Once that’s done and saved, we need to restart the Wazuh manager.
1
systemctl restart wazuh-manager.service
Now let’s regenerate the mimikatz telemetry on our client PC to see if our workflow will work so far. We will run mimikatz again on our client PC and start the webhook. We can see workflow executions by clicking on the ‘Show executions’ button below:
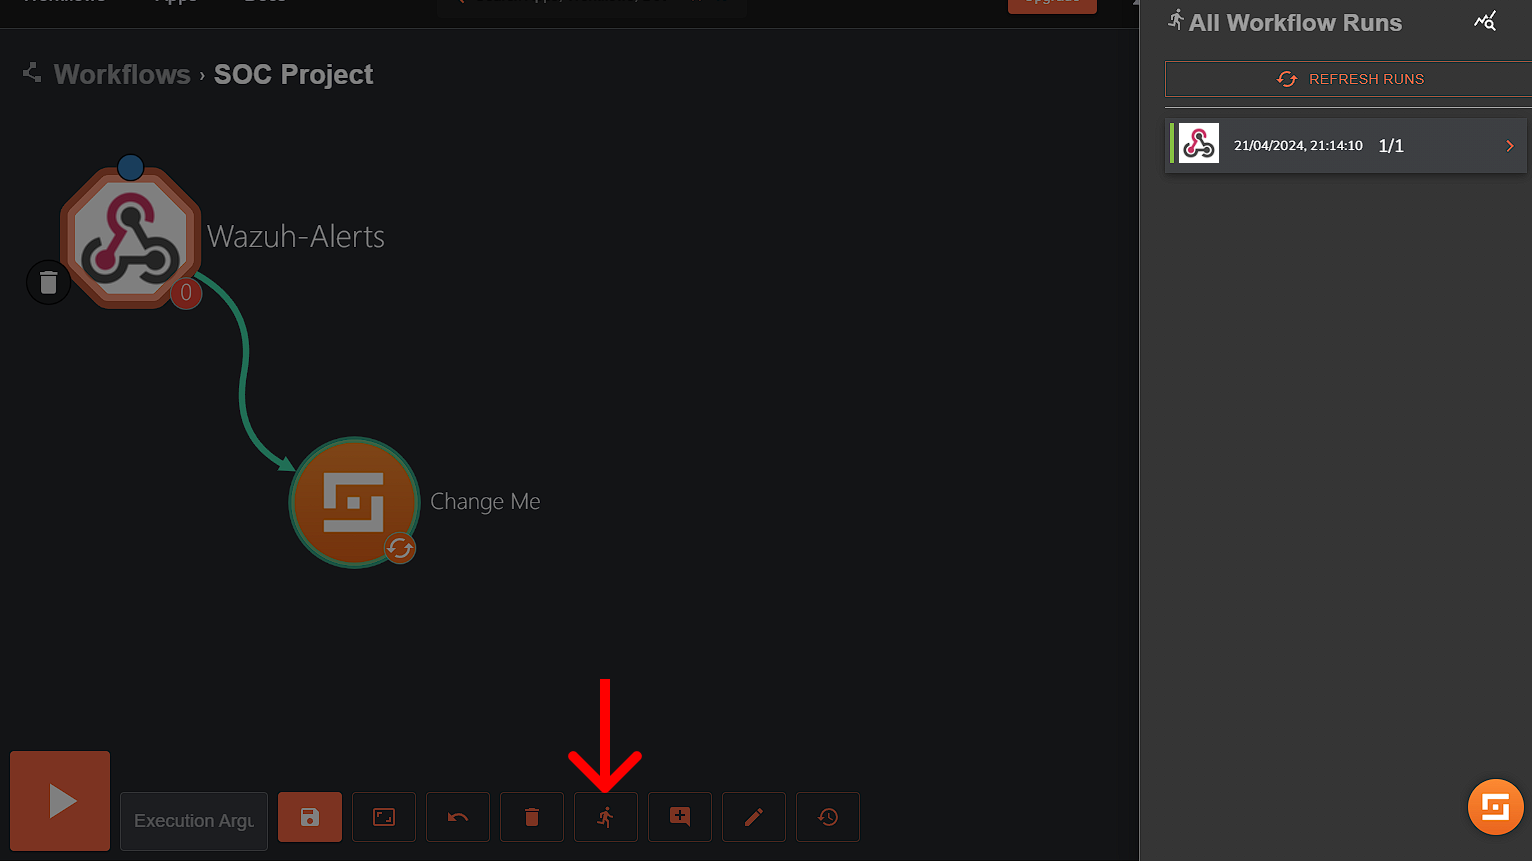
As we can see, a workflow run did pop up on the right. Clicking on this, we get the details of the workflow run.

The execution argument gave us all of the alert details that were generated from Wazuh! Our next step is to now extract the SHA256 file hash from the alert and check it with VirusTotal for any known security threats or malicious activities associated with the file (which will be very likely true for mimikatz).
Integrating VirusTotal
We can use Regex to parse the SHA256 file hash. This can be done by changing the ‘Find Actions’ dropdown inside the Shuffle Tools app to ‘Regex capture group’. Inside the ‘Input data’ text box, we will input $exec.text.win.eventdata.hashes (which is the source data or key that the Regex function should work on). and in the Regex textbox, we will create and input a Regex pattern that will look for the SHA256 hash and extract it.
1
SHA256=([A-Fa-f0-9]{64})
Essentially, this piece of Regex looks for
SHA256=in the string and captures the first 64 hexadecimal characters after it (which is the length of a SHA256 hash).

Now, we can go ahead and rerun the workflow to see if it extracts the SHA256 hash correctly.
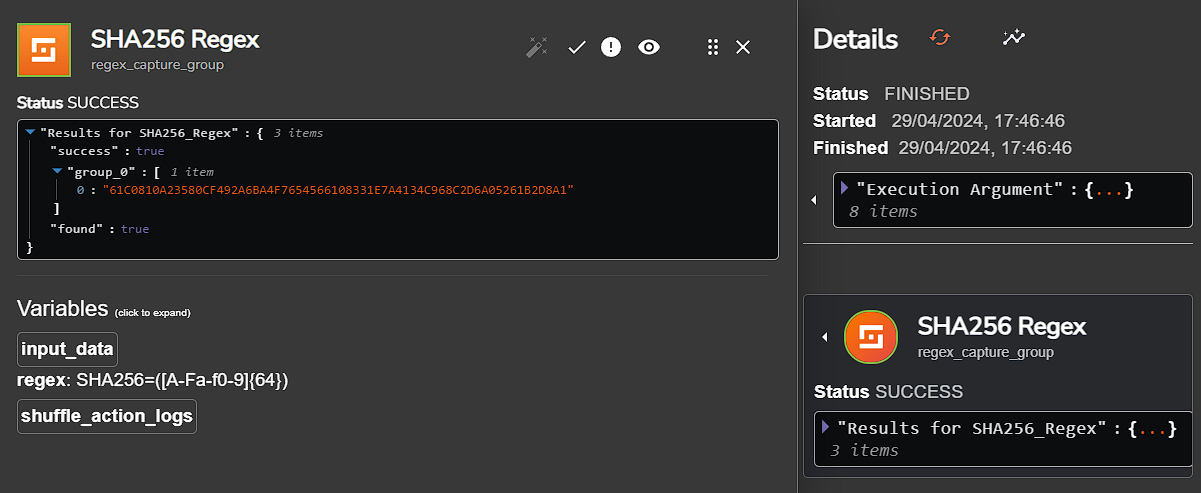
Our Regex function worked and extracted the hash! Our next step is to send that hash over to VirusTotal and receive its reputation score.
To begin, we will need to add the VirusTotal app and add authentication so we can connect to VirusTotal’s API. We’ll also change the ‘Find Actions’ dropdown to ‘Get a hash report’.
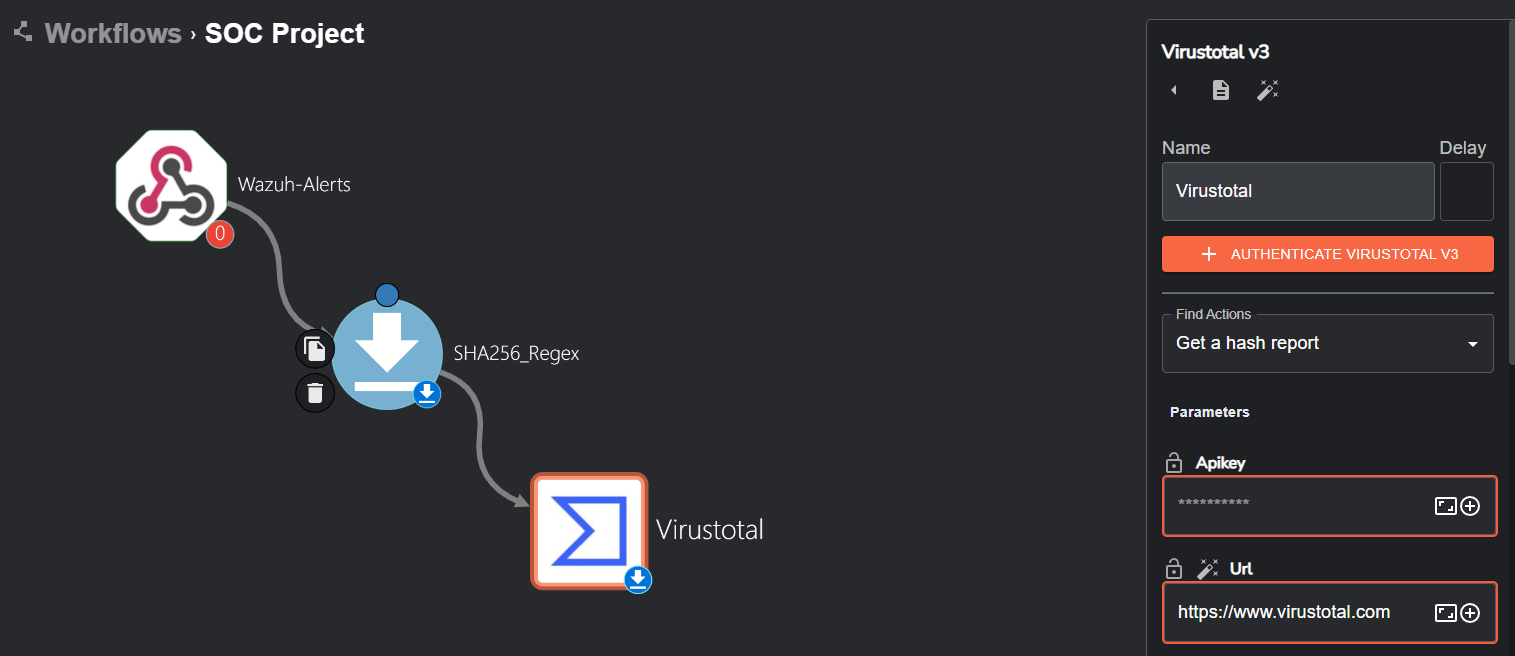
However, we will need an API key to authenticate, which can obtained after you create an account with VirusTotal. Once our API key is copied, we can click the ‘AUTHENTICATE VIRUSTOTAL V3’ button and authenticate.

The only parameter we’ll need to change in our VirusTotal app is ‘Id’. As seen previously in the workflow run for extracting the SHA256, the hash string is under the “group_0” key, so we’ll need to input the variable containing the hash string.
So, we’ll just check if we do get this hash report from VirusTotal by rerunning our workflow.

It looks like a success! We got back a JSON object from VirusTotal with a "status":200 (HTTP status code that means the request was successful) containing a body of data all related to the file analysis such as hashes, sandbox verdicts and antivirus scan results. Furthermore, the last_analysis_stats key provides how many vendors flagged it as malicious, and ultimately tells us if the file is safe or not.
1
2
3
4
5
6
7
8
9
10
"last_analysis_stats": {
  "malicious" : 64
  "suspicious" : 0
  "undetected" : 8
  "harmless" : 0
  "timeout" : 0
  "confirmed-timeout" : 0
  "failure" : 0
  "type-unsupported" : 4
}
Integrating TheHive
As previously mentioned, TheHive will be used for our case management. To start, we’ll add TheHive app to our workflow.
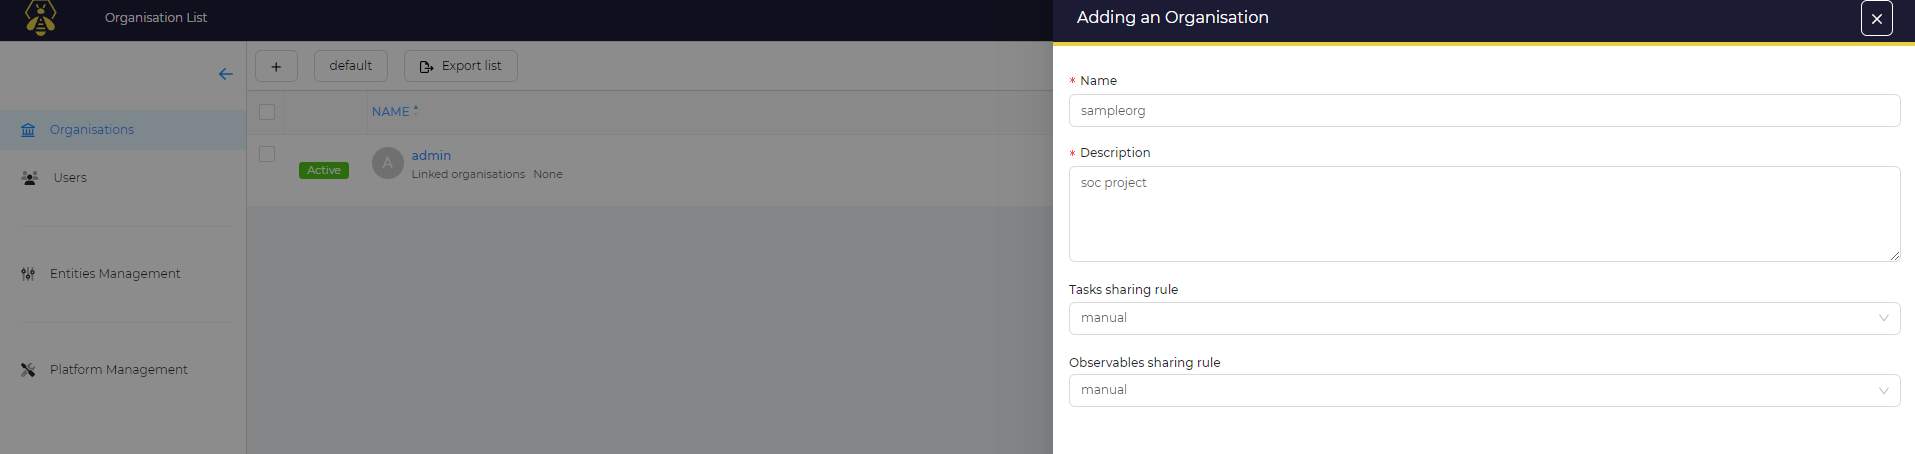
We need to configure a few things related to organisations and users, so head over to TheHive dashboard. Currently, there is one default organisation, admin, that contains one user with full admin privileges but we will create a new organisation. To do this, head to the organisations tab and click on the + icon, then give it a name and description.
After that, we’ll add the 2 users. One user will be of normal type, which is a regular account that an individual would use to manage and respond to security incidents (or just users with GUI access), then giving the user a name, login, and profile with pre-defined permissions which we will put it as analyst. The 2nd user will be of type service, which is designed for API users or bots. It will also require a name, login, and profile will be analyst too.
| Normal user | Service user |
|---|---|
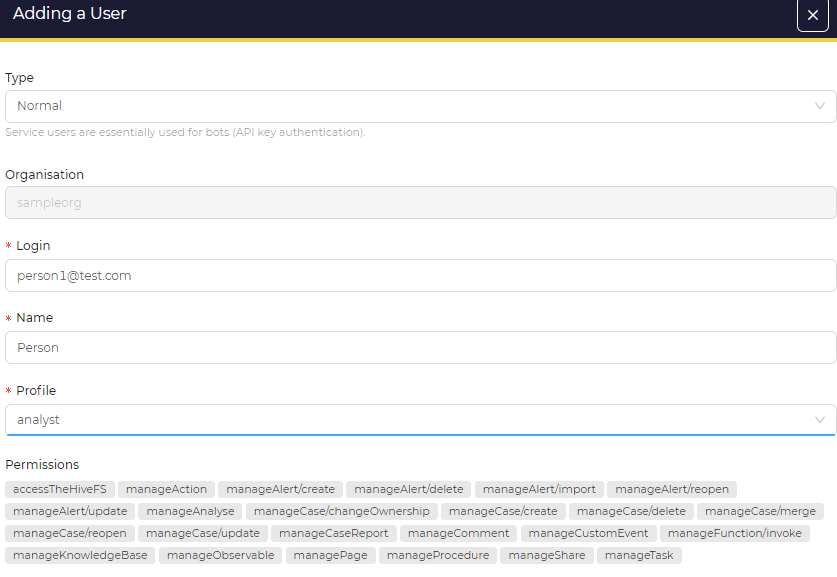 | 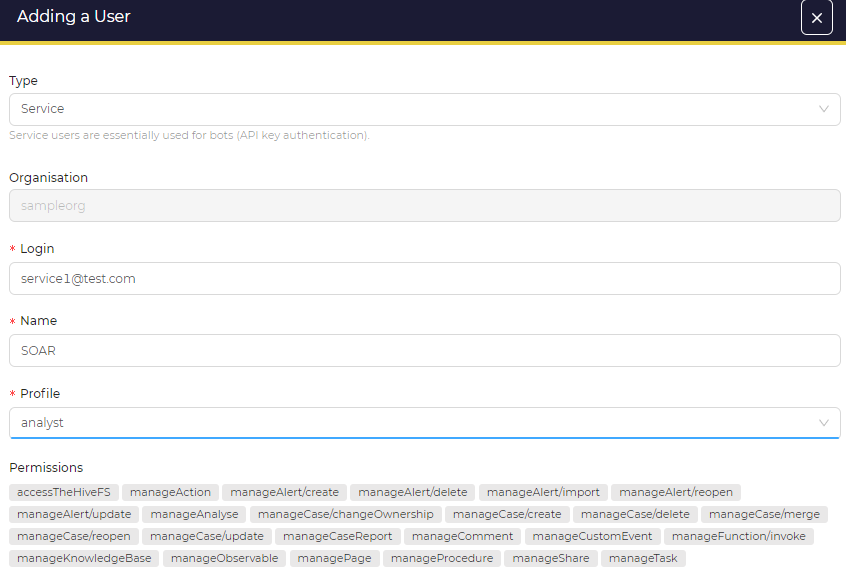 |
After we’ve completed that, we’ll also need to give the normal type user a password. To authenticate with Shuffle, we’ll generate an API key from the service type user and keep note of it. These options can be accessed by pressing the preview button when hovering over a user.
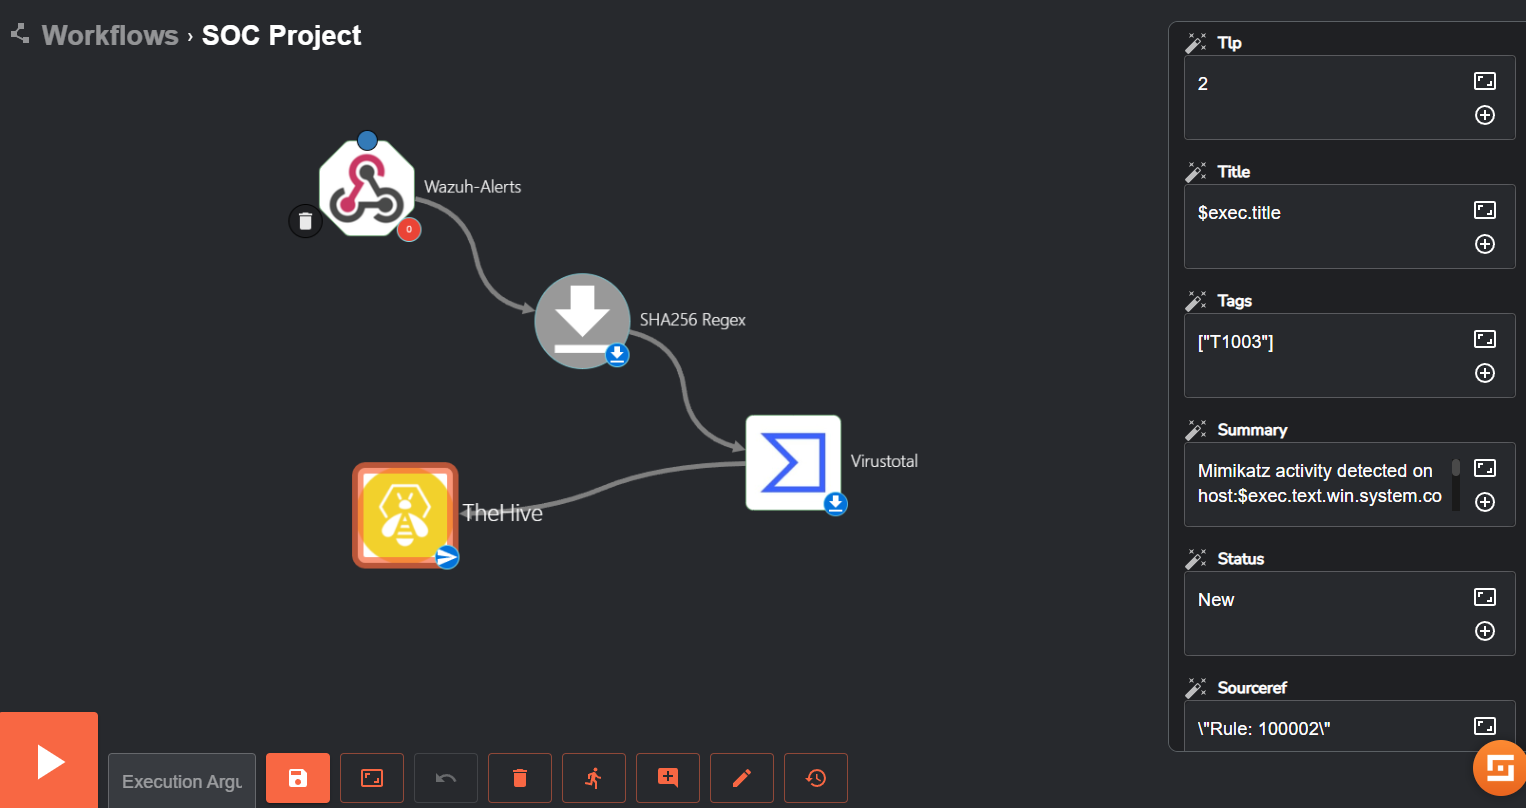
Heading back to shuffle, we’ll authenticate TheHive app with the API key just like we did with VirusTotal earlier. But the URL will be the IPv4 address of TheHive server on port 9000 (http://ipaddress:9000). We can then change the ‘Find Actions’ dropdown to ‘Create alert’, the alert will need to have a date, description, and more. So, after clicking on the ‘Hide Body’ checkbox, we can edit a few parameters/text boxes for TheHive app, these include:
- Date: We’ll go into execution argument and choose
utcTime, so the full argument inside the textbox should look like$exec.text.win.eventdata.utcTime. - Description: This will be custom-made combining execution arguments like hostname and user. A sample description can be “Mimikatz detected on host:
$exec.text.win.system.computerfrom user:$exec.text.win.eventdata.user”. - Flag: Case’s flag, True to mark the case as important. We’ll make it false.
- Pap: Stands for Permissible Actions Protocol. This field is used to define the level of exposure or sharing restrictions of the alert information, dictating whether to take an active or passive response. We’ll set it as 2 for AMBER, more information on these protocols can be found here.
PAP levels and their corresponding number, source. WHITE 0 GREEN 1 AMBER 2 RED 3
- Severity: This will be 2, for medium severity.
- Source: Wazuh
- Sourceref: We can put the rule ID, “Rule: 100002”.
- Status: New
- Summary: More detailed description, we can include more details such as processID and commandLine. An example summary would be, “Mimikatz activity detected on host: $exec.text.win.system.computer and the processID is: $exec.text.win.system.processID and the command line is: $exec.text.win.eventdata.commandLine”
- Tags: We can create tags using a string array, we’ll make one that contains just a string for the MITREid: [“T1003”]
- Title: We can just tie it to the alert itself using the execution argument: $exec.title
- Tlp: Stands for Traffic Light Protocol, which relates to the confidentiality and handling of information. We’ll make it 2 for AMBER.
- Type: Internal
So far, so good.
Before we rerun our workflow, we’ll need to modify the firewall for the droplets to allow incoming traffic from all IPs on port 9000 so it can work. So, we can head over to DigitalOcean to add a custom rule to the firewall.

Now we can rerun our workflow and see if it’s successful. It turns out that it did work correctly. Let’s check if the alert was generated by logging in the user of normal type we made earlier (with the sample email and password we configured earlier) and heading to the alerts tab.
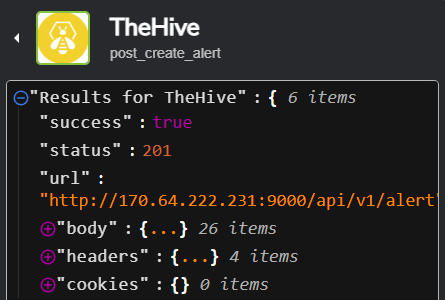
Hooray! Our alert was generated, along with all the fields and metadata we gave it in Shuffle.

Clicking on the alert, much more information about it is displayed, along with the summary we configured earlier.
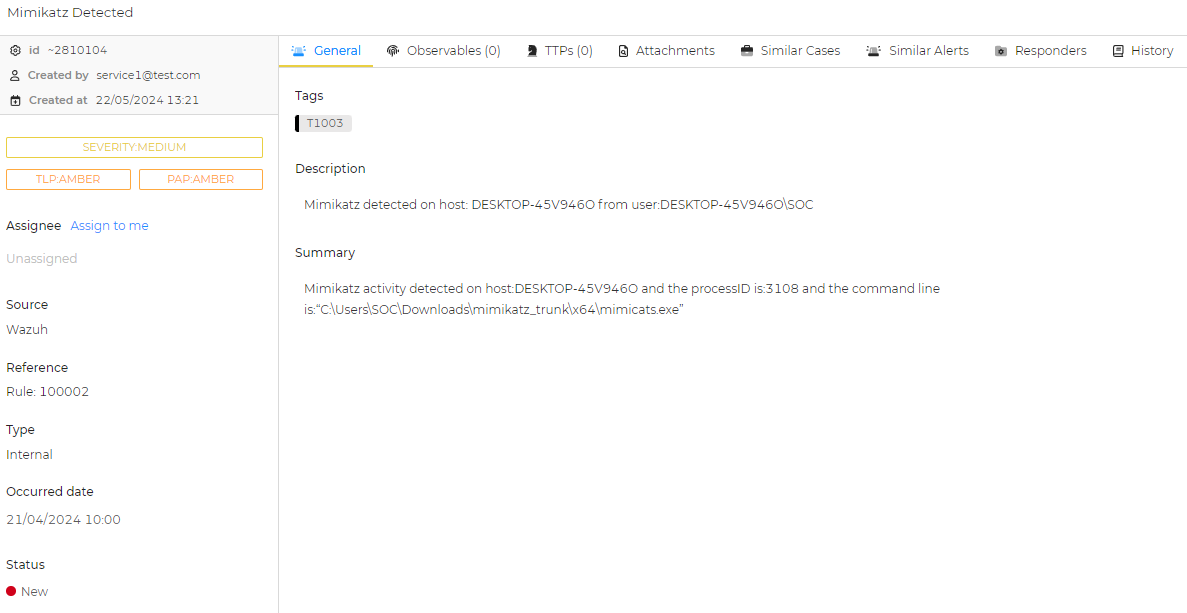
Ultimately, our case management component should now be complete. Our next step is to create functionality to send an email to us with these alert details and take an active response from the email.
Email setup
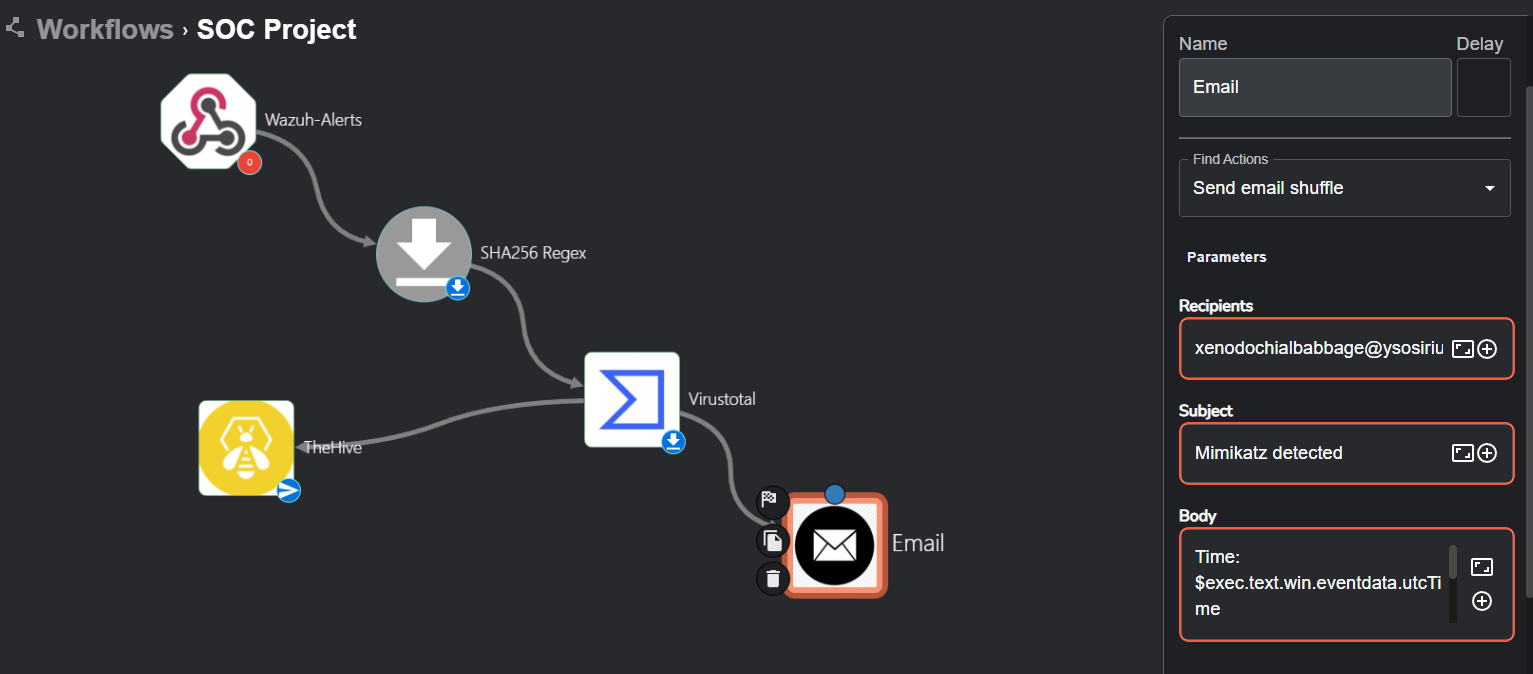
Integrating the email app is really easy, once we’ve added it to our workflow and connected VirusTotal to it, all we have to do is specify the recipient, subject, and body.
I’ve used a disposable email by SquareX to test this out. We can then write a subject and body that tells us that mimikatz has been detected along with some other relevant details. My sample body was:
1
2
3
Time: $exec.text.win.eventdata.utcTime
Title: $exec.title
Host: $exec.text.win.system.computer
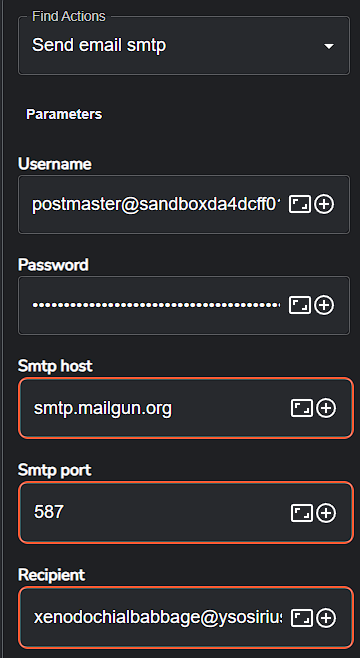
This never worked out. The email app turned out to be broken and could not send emails over shuffle, I was talking to a shuffle developer through the shuffle discord and he verified that it was broken for everyone (not just me), he said that a patch would roll out soon to fix it which is great. But for now, instead of sending emails over shuffle, I used the
Send email smtpoption instead. I needed an Email API, so I signed up to SendGrid at first, but that gave me issues and didnt work. I then tried Mailgun, and that worked pretty much flawlessly thankfully.
After signing up for Mailgun, I took note of the SMTP hostname, port and credentials and plugged them into Shuffle as so.
Now we can rerun the workflow and check to see if we get an email with the body we created.
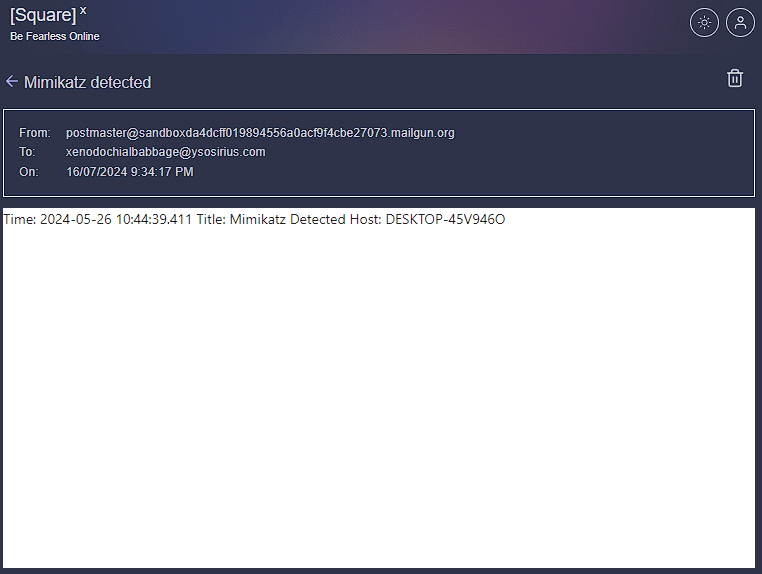
Hooray! We got an email containing the time, title and host machine. This, of course, could be improved to be more professional and contain even more details about the event. We now have a complete workflow that receives a mimikatz alert from Wazuh, takes the SHA256 of the file, runs it through VirusTotal, creates an alert in TheHive and sends an email out about the alert. Now we’re left with the active response component.
Active response
This part was really difficult to plan because there weren’t many resources or examples to read up on. In my research of Wazuh’s active response capabilities on a Windows endpoint, I came across this proof of concept guide which is on detecting and removing malware.
TLDR: We enable the FIM (File integrity monitoring) module in Wazuh to monitor for a directory in near real-time. Then add VirusTotal integration and active response code blocks inside
/var/ossec/etc/ossec.confwhich will enable Wazuh to run a Python script (turned into an executable) to remove the malicious file determined by VirusTotal. Lastly, we create 2 rules in/var/ossec/etc/rules/local_rules.xmlto alert about the active response results.
I did test it out myself and it worked correctly, but it is rather slow, taking around 3-5 seconds for the full detection and deletion process to complete (in a real-world situation, this would be completely useless because the malware would be executed instantaneously).
Apologies for the bad video quality

We can combine this with our Shuffle workflow so that when Mimikatz is executed, it goes through the workflow and we ultimately get an email that says it was run but also deleted. This approach is the best possible outcome I can get working with Wazuh’s limited/not flexible active response capabilities and the ultimate conclusion to the project that I can implement.
Unfortunately, this approach didnt work at all. Wazuh will be able to delete malware that is downloaded into the downloads folder, but if the file is downloaded and run immediately after, Wazuh will not be able to forcefully delete the malware (either because the malware is being actively used or something else I’m not aware of).
Click on the pop out icon for better quality
Concluding thoughts
This project turned out way bigger and much longer than I ever thought it would be. But, I did learn so much when it comes to security operations, especially a lot of terminology such as PAP and SOAR. It was really cool to install and configure a SIEM, case management platform and configure endpoints (deploying Wazuh agents to ingest logs from sysmon). In addition, using Wazuh to sift through alerts, create custom rules, and learn about the MITRE ATT&CK framework, was all very insightful. Lastly, using Shuffle to learn about SOAR for workflow automation was great through utilising webhooks to take Wazuh alerts, combining different apps/tools such as extracting info like file hash with regex, and integrating VirusTotal to check if the file hash is malicious.
Although I couldn’t get the active response aspect to work as well as I hoped it would with Wazuh (such as stopping the malware if it were to be run), I’m excited to work on new projects and challenges! I hope you enjoyed my adventure in creating a makeshift SOC environment and learned a thing or 2 about security operations :D
Massive thank you to MyDFIR for the incredible project.
Thank you for reading! 😊